Basic Test of the tshirt Spectroscopic Pipeline
This tutorial describes the basics of how to use the tshirt spectroscopic pipeline. This can also be run to test that the code has installed correctly.
Initial Setup
First, make sure the environment is loaded within bash, if it is not already set. Then start a python session or Juypyter notebook
conda activate astroconda
jupyter notebook
Import Code and Run Extraction
Import the code and set up the example parameters. The example parameter set is available at https://github.com/eas342/tshirt/blob/master/tshirt/parameters/spec_params/example_spec_parameters.yaml This will extract spectra from the images in ../example_data/spec_time_series/
[3]:
from tshirt.pipeline import spec_pipeline
spec = spec_pipeline.spec()
spec.do_extraction(useMultiprocessing=True)
%matplotlib inline
On 0 of 4
Plotting Results
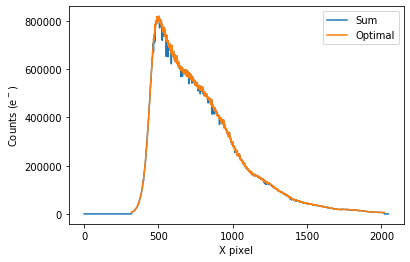
Now you can plot an example spectrom from the time series.
[4]:
spec.plot_one_spec()
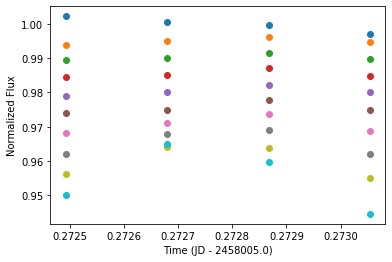
plot_wavebin_series will plot the time series for wavelength-binned data
[5]:
spec.plot_wavebin_series(savePlot=False)
/Users/everettschlawin/es_programs/tshirt/tshirt/pipeline/spec_pipeline.py:1407: UserWarning: Matplotlib is currently using module://ipykernel.pylab.backend_inline, which is a non-GUI backend, so cannot show the figure.
  fig.show()
[ ]: